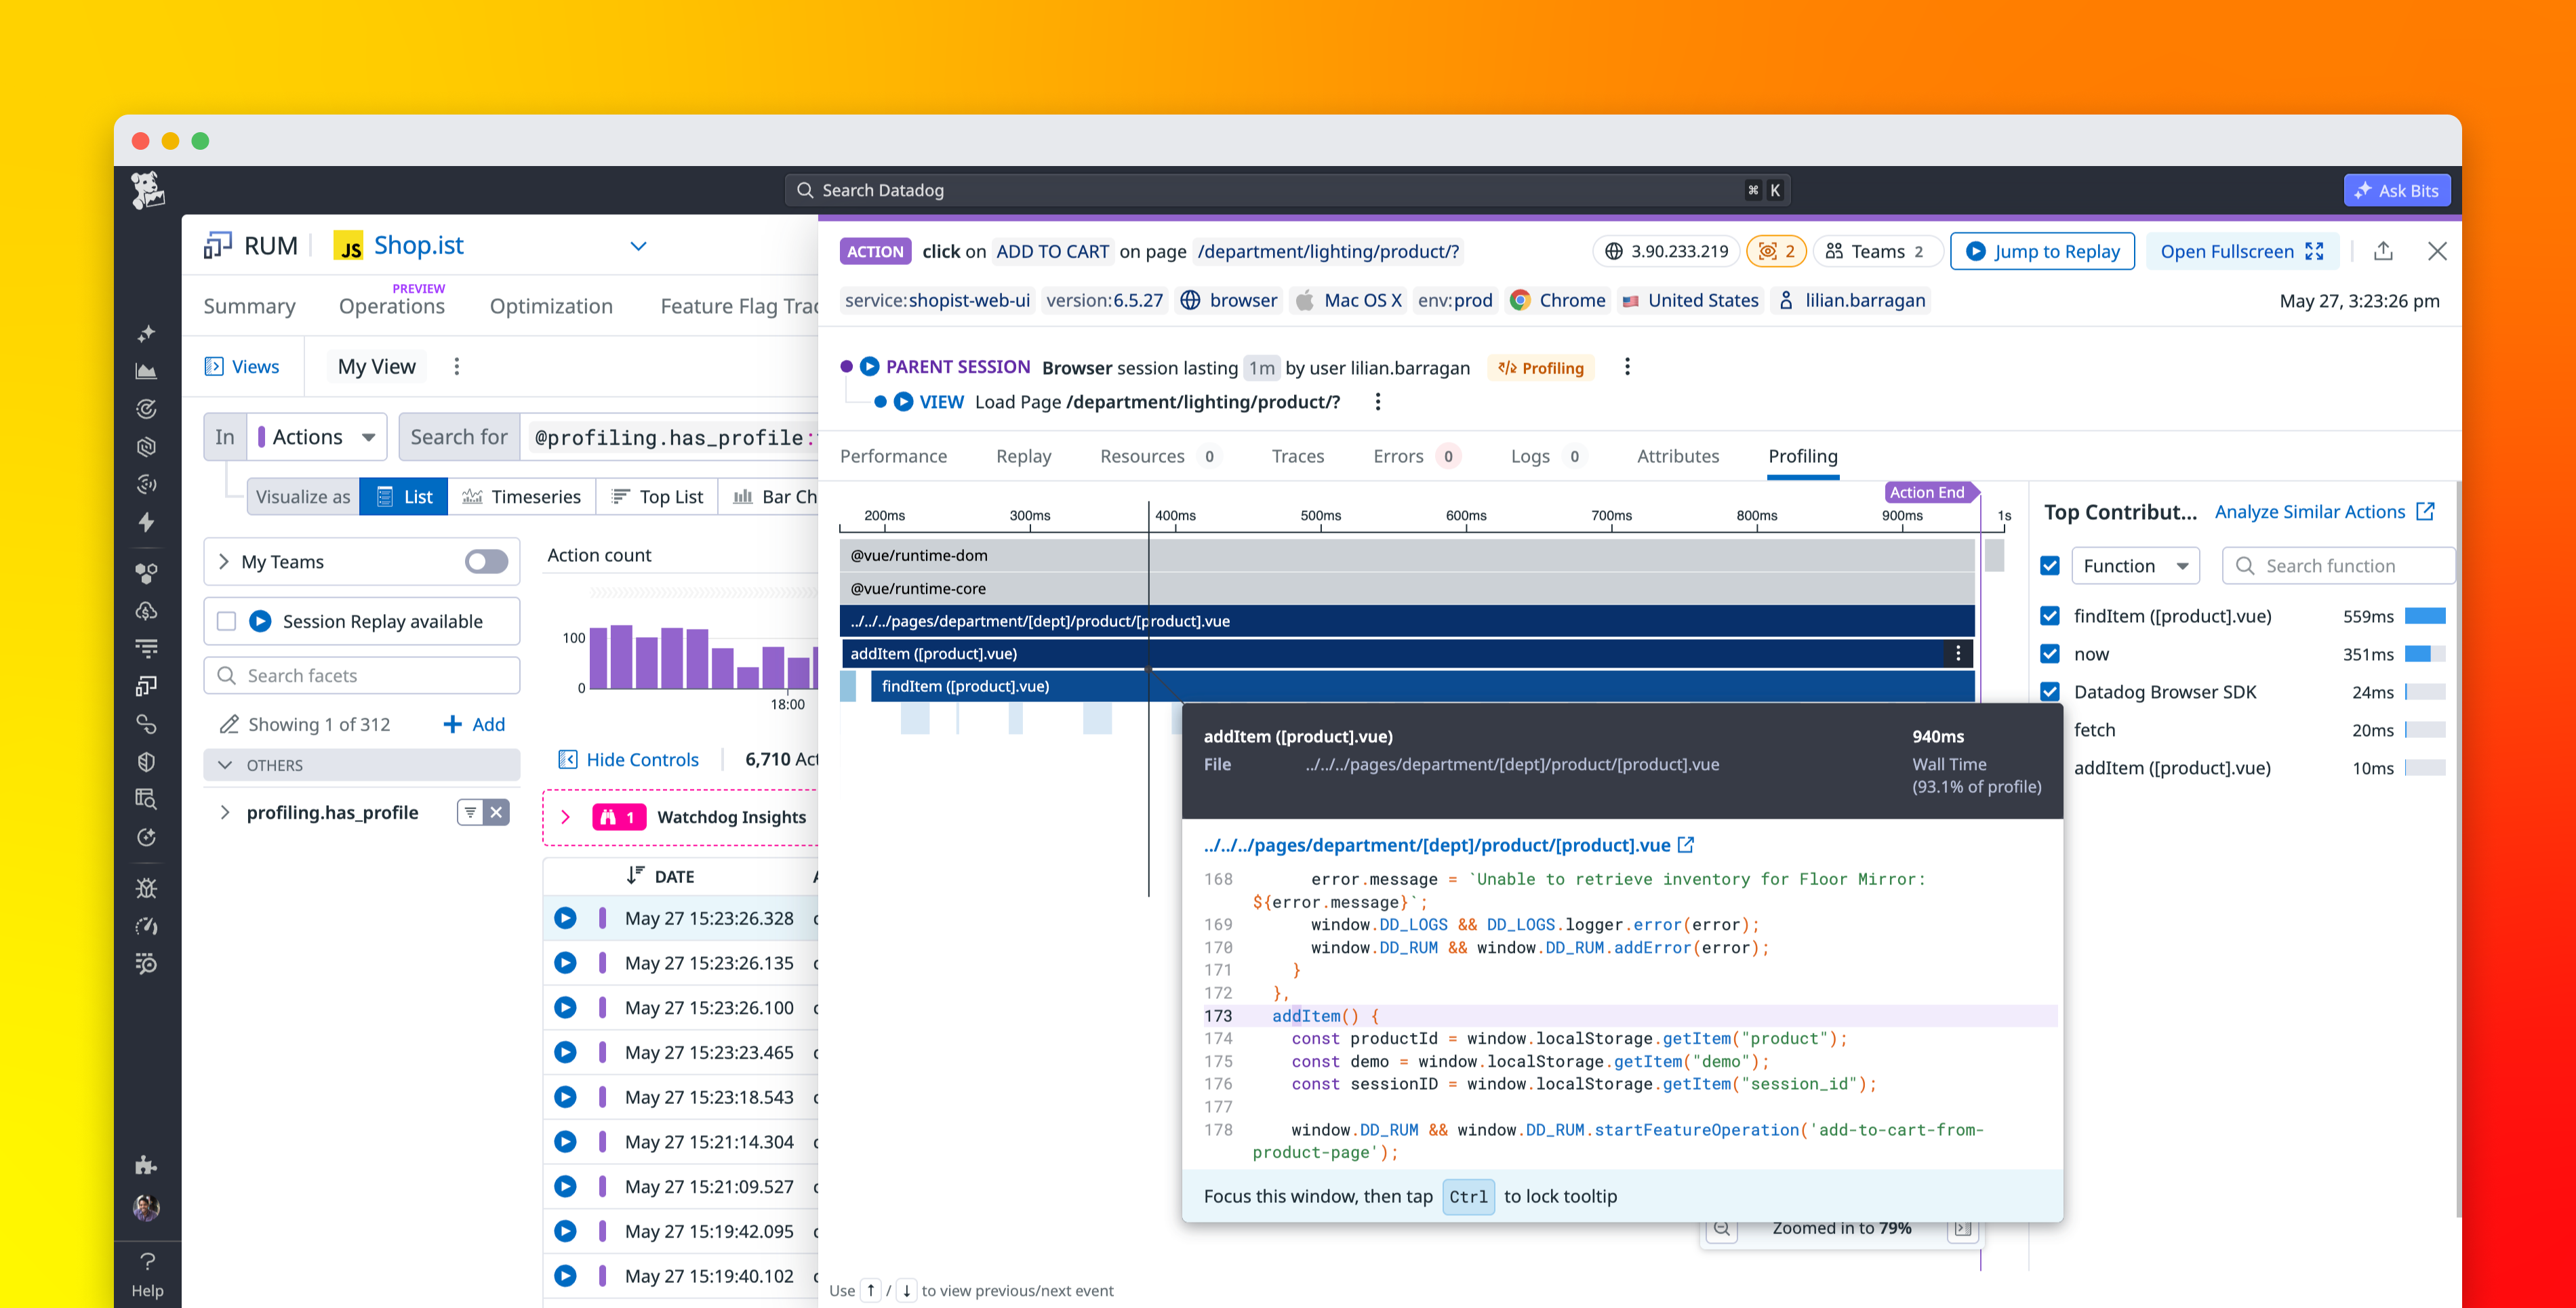
Troubleshoot frontend performance with Datadog’s Browser Profiler
Datadog | The Monitor blog

Troubleshoot frontend performance with Datadog’s Browser Profiler


Summary

Datadog’s Browser Profiler helps frontend engineers identify the specific JavaScript code causing performance regressions by linking method stack frames from real user sessions directly to RUM workflows. The tool enables teams to pinpoint root causes, detect systemic bottlenecks across large user bases, and use a comparison view to validate that performance fixes are effective after deployment.
Read the Original Article

This article originally appeared on Datadog | The Monitor blog.

Read Full Article on Original Site


Popular from Datadog | The Monitor blog

1
DASH 2026: Guide to Datadog’s newest announcements

Datadog | The Monitor blog Jun 9, 2026 206 views

2
DASH 2026 Harnessing AI: Guide to Datadog’s newest announcements

Datadog | The Monitor blog Jun 9, 2026 178 views

3
Datadog LLM Observability natively supports OpenTelemetry GenAI Semantic Conventions
4
Introducing Bits AI Dev Agent for Code Security

Datadog | The Monitor blog Mar 26, 2026 107 views