Visualize user interactions with your pages by using Scroll Maps in Datadog Heatmaps
Datadog | The Monitor blog

Visualize user interactions with your pages by using Scroll Maps in Datadog Heatmaps


Summary

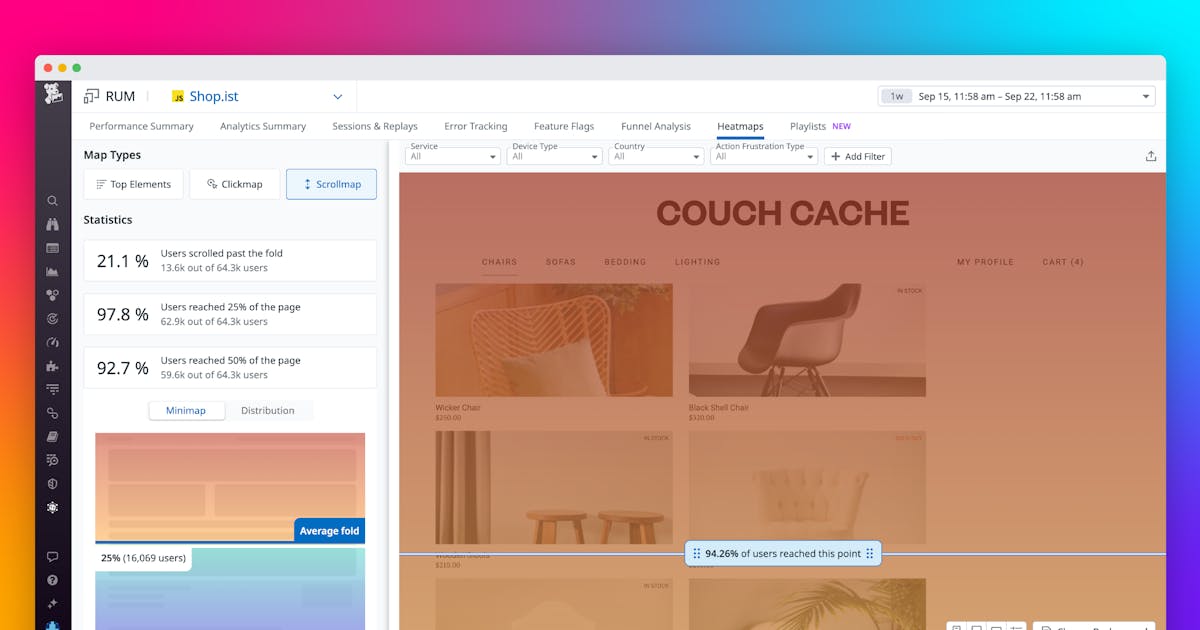
Datadog Product Analytics helps product teams understand user behavior within their applications to make data-driven decisions. It goes beyond basic analytics by offering session replays, heatmaps, and funnel analysis, allowing teams to pinpoint friction points and optimize the user experience. Ultimately, it aims to accelerate product development and improve key metrics like conversion and retention.
Read the Original Article

This article originally appeared on Datadog | The Monitor blog.

Read Full Article on Original Site

Popular from Datadog | The Monitor blog

1
Datadog LLM Observability natively supports OpenTelemetry GenAI Semantic Conventions
2
Introducing Bits AI Dev Agent for Code Security

Datadog | The Monitor blog Mar 26, 2026 85 views

4
Understand session replays faster with AI summaries and smart chapters

Datadog | The Monitor blog Apr 2, 2026 71 views

5
Monitoring MongoDB performance metrics (MMAP)

Datadog | The Monitor blog May 25, 2016 71 views