Grafana Labs: Top 10 moments of 2025
Summary
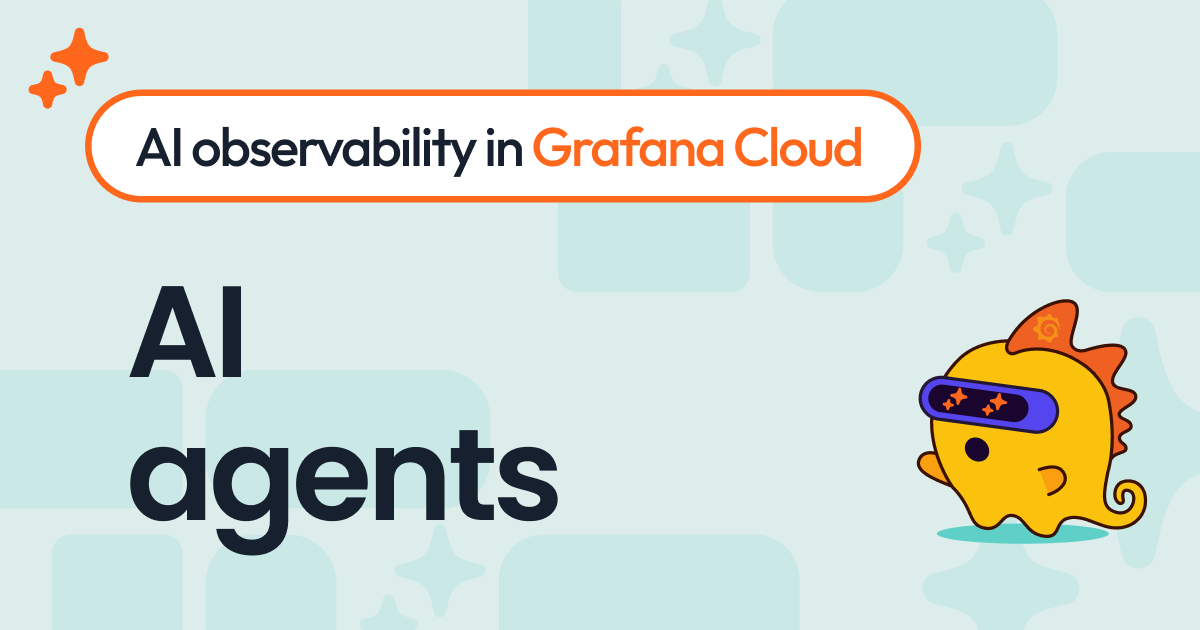
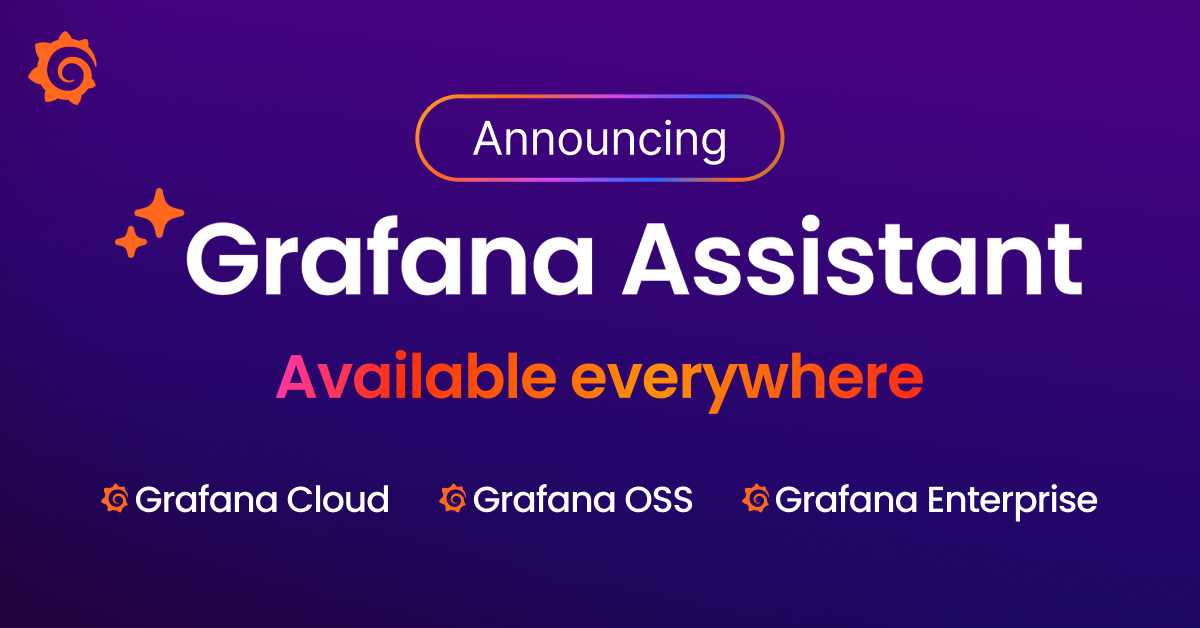
For Grafana Labs, 2025 was a year defined by innovation, growth, and the power of our community. We celebrated the release of Grafana 12 at our 10th annual GrafanaCON event, and marked major milestones across open source projects, including Mimir, k6, Beyla, Faro, and Alloy.�� It was also a year of taking bold steps forward in how teams interact with their systems and data. With the launch of our actually useful AI-powered agent Grafana Assistant, our end-to-end Adaptive Telemetry suite, and Grafana Cloud Knowledge Graph, we continued on our mission to make observability smarter, easier, and more accessible to everyone. Just as importantly, 2025 was a year of strengthening the bonds across our global community. We expanded our presence in Japan and shared insights from more than 1,200 practitioners from around the world in our third annual Observability Survey.�� ���It���s really satisfying for me to sit back and realize that we���ve become a force in open source observability, but we���ve done it as part of this wider community and wider ecosystem,��� said Raj Dutt, CEO and co-founder of Grafana Labs, at GrafanaCON this year.�� Here���s a look at some of the top moments that defined 2025 at Grafana Labs.�� 1. Actually useful AI with Grafana Assistant�� If you don’t mention AI, are you even a tech company?�� At Grafana Labs, though, AI is much more than the latest observability trend. It���s become essential to how organizations keep their systems running, and we want it to play a pivotal role in simplifying the observability experience for every user. Grafana Assistant ��� our AI-powered agent in Grafana Cloud ��� deeply reflects this belief. What started as an internal hackathon project at the beginning of the year quickly evolved into a generally available feature that lets you query, build, and troubleshoot faster using natural language.�� We���ve seen teams use it for simplified onboarding, faster debugging, and easier dashboard building for every use case. (The color-coded Taylor Swift eras dashboard? Assistant helped build that.) The best part? We���re just getting started. We���ve also rolled out Assistant Investigations (in public preview), an AI-powered feature that extends Grafana Assistant to accelerate multi-step incident investigations.���� For more information, check out our Assistant docs.�� 2. Grafana 12 release and more OSS milestones Even as the observability market moves at warp speed, one thing remains constant for us: open source software will always be part of our DNA.�� ���We really believe, and continue to believe, that open source is going to win, and is ultimately the best way to develop software,��� Raj told attendees at GrafanaCON 2025, where we launched Grafana 12.�� The latest major release introduced powerful observability as code features, such as Git Sync and dynamic dashboards. There were also some fun data visualization updates (who doesn���t love a new dashboard theme?!) and an expansion of our Grafana Drilldown suite of applications for queryless, point-and-click data exploration. Many of our other open source projects hit major milestones this year ��� milestones we couldn���t have reached without the support of our OSS community.�� Mimir 3.0: This major release delivers dramatic improvements in reliability, performance, and cost efficiency, marking a new era for the open source, horizontally scalable, multi-tenant time series database (TSDB). k6 1.0:�� k6 1.0 rolled out with TypeScript support, revamped test insights, and clear support and versioning guarantees to power the next decade of performance and reliability testing. Beyla 2.0: The latest major release of our vendor-agnostic, open source eBPF zero-code instrumentation tool introduced performance and functional improvements ��� like support for new protocols and distributed tracing ��� along with deeper alignment with the OpenTelemetry project (spoiler alert: more on that below).�� Faro 2.0: Released in November, v2.0 of the Faro Web SDK introduces improvements to Web Vitals, simplifies configuration, cleans up deprecated internals, and more to provide a more streamlined and performant user experience.�� One-year anniversary for Alloy: In May, we celebrated one year of Grafana Alloy, our open source OpenTelemetry collector with built-in Prometheus pipelines and support for metrics, logs, traces, and profiles.�� You can read more about OSS updates on our blog. 3. OpenTelemetry eBPF Instrumentation: Beyla donated to the OTel project Over the years, we���ve prioritized contributing to the OpenTelemetry project and building compatibility with OpenTelemetry into our products and open source projects. Beyla is a leading example of both of those efforts. This year, with the support from both Grafanistas and the open source community, we officially donated Beyla to OpenTelemetry, under the new project name OpenTelemetry eBPF Instrumentation (commonly referred to as OBI). It was a special moment for us, and one that marked a significant milestone in the evolution of zero-code eBPF instrumentation within the open source community at large. As part of the donation, we announced that Beyla will continue to exist as Grafana Labs��� distribution of the upstream OpenTelemetry eBPF Instrumentation. In August, we rolled out Beyla 2.5, the first Beyla release where we directly vendored most of the code from the upstream repository.�� Looking ahead, we���re excited to continue collaborating and driving further innovation around zero-effort instrumentation within the OTel community. To learn more about OpenTelemetry eBPF Instrumentation, visit OpenTelemetry docs.�� 4. First-ever “Science Fair” at GrafanaCON�� There were no exploding volcanoes, but there were 3D printers and plenty of IoT devices.�� Our 10th annual GrafanaCON featured our inaugural Science Fair, a series of interactive booths���complete with tri-fold poster boards���where attendees could check out and play with projects demonstrating all the different things you can monitor with Grafana. Highlights included the team from PRUSA monitoring a 3D printer (mini Grots for everyone!); a desktop wind tunnel built for model race cars created by Grafana Labs CTO Tom Wilkie; and the hackathon booth, where attendees could get hands-on with popular projects from Grafana Labs hackathons, like Dash Dash Revolution and Doomfana. In addition to the Science Fair, GrafanaCON 2025 featured more than 32 live sessions, our Ask the Experts booth, hands-on labs, a welcome reception, and more fun, community-driven activities. Want to get in on the action next year? Be sure to sign up to get notified when discount tickets are available and get an early heads-up about all the topics we’ll be highlighting at GrafanaCON 2026, which will take place April 20-22 in Barcelona.�� 5. Named a Leader in the Gartner�� Magic Quadrant��� for Observability Platforms (again!)�� Grafana Labs is proud to be recognized as a Leader in the 2025 Gartner�� Magic Quadrant��� for Observability Platforms for the second year in a row. This year���s report placed Grafana Labs furthest to the right of the Magic Quadrant for ���Completeness of Vision,��� which we believe reflects our deep commitment to building a full-stack open observability platform that gives users flexibility, control, and the tools to own their observability strategy. This was one of several recognitions in 2025 that demonstrated how our company and community is playing a vital role in shaping the future of observability. We were also honored to be included in: The Forbes Cloud 100 list, which recognizes the top private cloud companies in the world; Grafana Labs ranked number 13.�� The Silicon Valley Defense Group���s NATSEC100, which ranked Grafana Labs 26th out of ���the top 100 venture-backed, dual-use and defense technology companies driving forward U.S. national security.��� The Coolest DataOps and Data Observability Companies of the 2025 Big Data 100, produced by CRN. The InfraRed 100, an unranked list that honors transformative companies in cloud infrastructure. While we���re proud of these accolades, we���ll always consider our users��� success to be the ultimate validation of our products.�� ���We’re so privileged to be at the center of this really dynamic and vibrant ecosystem and community,��� Raj said at ObservabilityCON 2025.�� 6. The end-to-end Adaptive Telemetry suite More observability data doesn���t always bring more clarity ��� in fact, it often just creates more noise and costs. That���s why we built Adaptive Telemetry, a set of features in Grafana Cloud that optimizes observability data by ensuring only the most valuable telemetry is stored and surfaced. It uses intelligent classification and prioritization techniques to analyze how telemetry is used and then automatically recommends actions like aggregating, sampling, dropping, or reducing low-value data. Our Adaptive Telemetry suite started with Adaptive Metrics and Adaptive Logs, and this year expanded to include: Adaptive Traces (generally available): Automatically identifies and retains your most valuable traces using tail sampling to deliver critical performance insights.�� Adaptive Profiles (private preview): Dynamically adjusts data collection based on workload behavior, enabling continuous profiling at scale without high costs. Sign up here to join our private preview. ���Before Adaptive Traces, we had two bad options: send everything and blow our budget, or send so little we couldn���t get meaningful insight,��� said Geoff Schultz, Manager, Infrastructure Engineering at Auditboard. ���Now tracing is actually usable. We can dial sampling up or down as needed, keep costs in check, and still give teams the visibility they need.����� With this end-to-end Adaptive Telemetry suite, you can extend the benefits of the adaptive model across all core pillars of your observability strategy, ensuring every piece of telemetry you store is truly worth the investment.�� Check out our d
Read the Original Article
This article originally appeared on Grafana Labs blog on Grafana Labs.
Read Full Article on Original Site