Doing or Waiting?
Observatory | The New Relic Blog

Doing or Waiting?


Summary

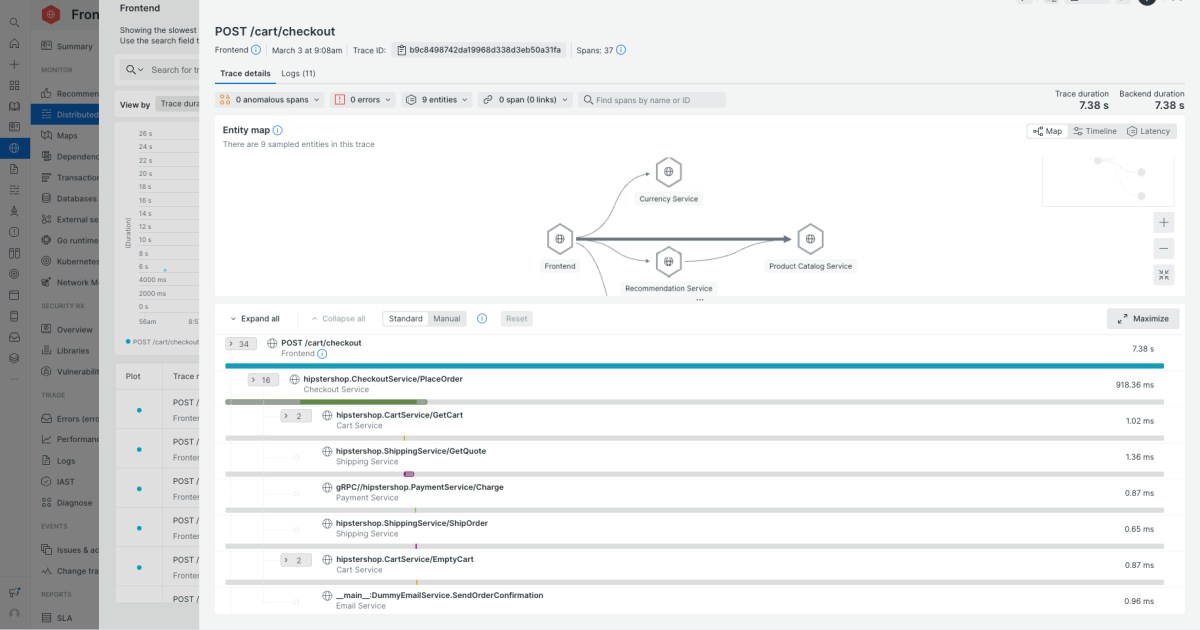
This article emphasizes the importance of understanding whether application performance bottlenecks stem from “doing” (CPU usage) or “waiting” (external dependencies or resource contention). By using observability tools like APM and distributed tracing, developers can pinpoint what an application is waiting for – be it direct requests to other services or indirect waits due to CPU limitations like garbage collection – and address the root cause. Ultimately, optimizing for both efficient processing and minimized waiting leads to improved performance and cost savings, as demonstrated by the example of optimizing SQL queries instead of simply adding more hardware.
Read the Original Article

This article originally appeared on Observatory | The New Relic Blog.

Read Full Article on Original Site

Related Articles

Google Cloud Platform Observability enhancements now GA

Rasheed Shaik Aug 4, 2026 3 shared categories

New Relic eBPF Expands Kernel-Level Observability

Ben Rivera Apr 30, 2026 3 shared categories

A New Era for New Relic’s Lambda Extension: From Go to Rust

Chodavarapu Naga Viswanadha Avinash Dec 9, 2025 3 shared categories

Enterprise APM: How to Choose Application Performance Monitoring at Scale

John Blust Sep 3, 2026 2 shared categories

APM Dashboard: What It Shows, How to Use It, and What to Look For

John Blust Sep 3, 2026 2 shared categories

Popular from Observatory | The New Relic Blog

1
New Relic eBPF Expands Kernel-Level Observability

Ben Rivera Apr 30, 2026 152 views

4
How to Choose Network Monitoring Tools You Can Act On

Spence Taylor Apr 6, 2026 148 views