Kubernetes Monitoring Tools: Essential Features & How to Choose the Right One
Observatory | The New Relic Blog

Kubernetes Monitoring Tools: Essential Features & How to Choose the Right One


Summary

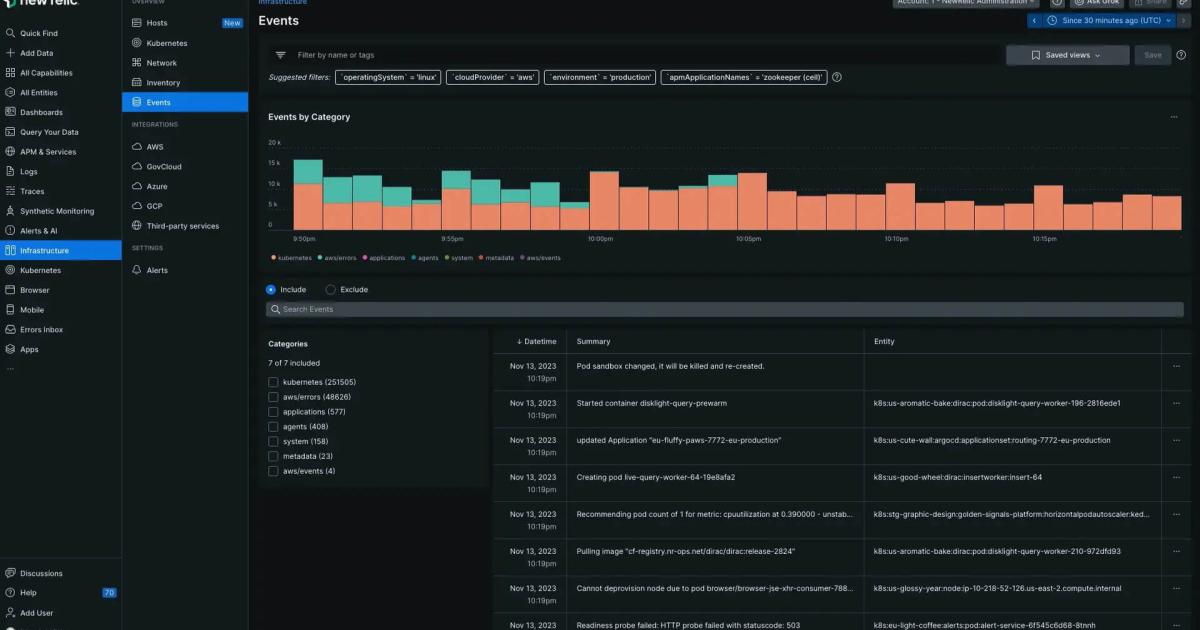
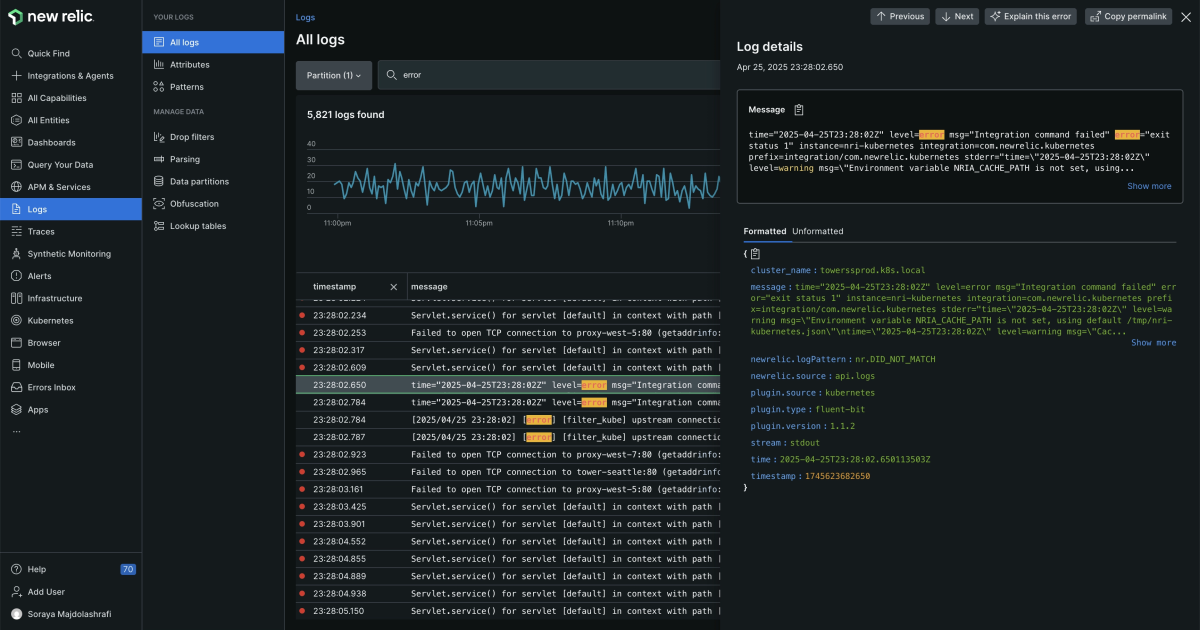
Effective Kubernetes observability requires unified visibility across metrics, logs, and traces to reduce incident response times and manage the dynamic nature of clusters. This guide compares leading monitoring solutions—ranging from integrated platforms like New Relic and Datadog to open-source stacks like Prometheus and Grafana—based on criteria such as automation, cost, and operational overhead.
Read the Original Article

This article originally appeared on Observatory | The New Relic Blog.

Read Full Article on Original Site

Related Articles

5 Best Distributed Tracing Tools to Debug Microservices Faster

Spence Taylor May 7, 2026 2 shared categories

5 Top Database Monitoring Tools for Reducing MTTR & Preventing Outages

Spence Taylor May 7, 2026 2 shared categories

How to Choose the Best Infrastructure Monitoring Tools (2026 Guide)

Spence Taylor May 7, 2026 2 shared categories

Cloud Monitoring Tools: 5 Best Platforms to Evaluate in 2026

Spence Taylor Mar 25, 2026 2 shared categories

Is it vibe coding if you know what you’re doing?

Jeff Blankenburg Dec 24, 2025 2 shared categories

Popular from Observatory | The New Relic Blog