Zabbix and the Docker API, Part 2: Adapt
This article provides a step-by-step guide on creating a Zabbix template to monitor Docker servers using only API calls via the HTTP agent, eliminating the need for the Zabbix Agen…
This article provides a step-by-step guide on creating a Zabbix template to monitor Docker servers using only API calls via the HTTP agent, eliminating the need for the Zabbix Agen…
The article describes how the AI agent landscape has evolved from a linear "stack" in 2025 to a more complex "operating system" model in 2026. This shift is driven by agents moving…
To combat attackers who exploit fragmented local networks, US states are transitioning toward a "whole-of-state" cybersecurity model that treats the entire regional ecosystem as a …
Grafana has launched the public preview of gcx, a new CLI tool designed to bring production observability directly into the terminal. By providing real-time access to metrics, logs…
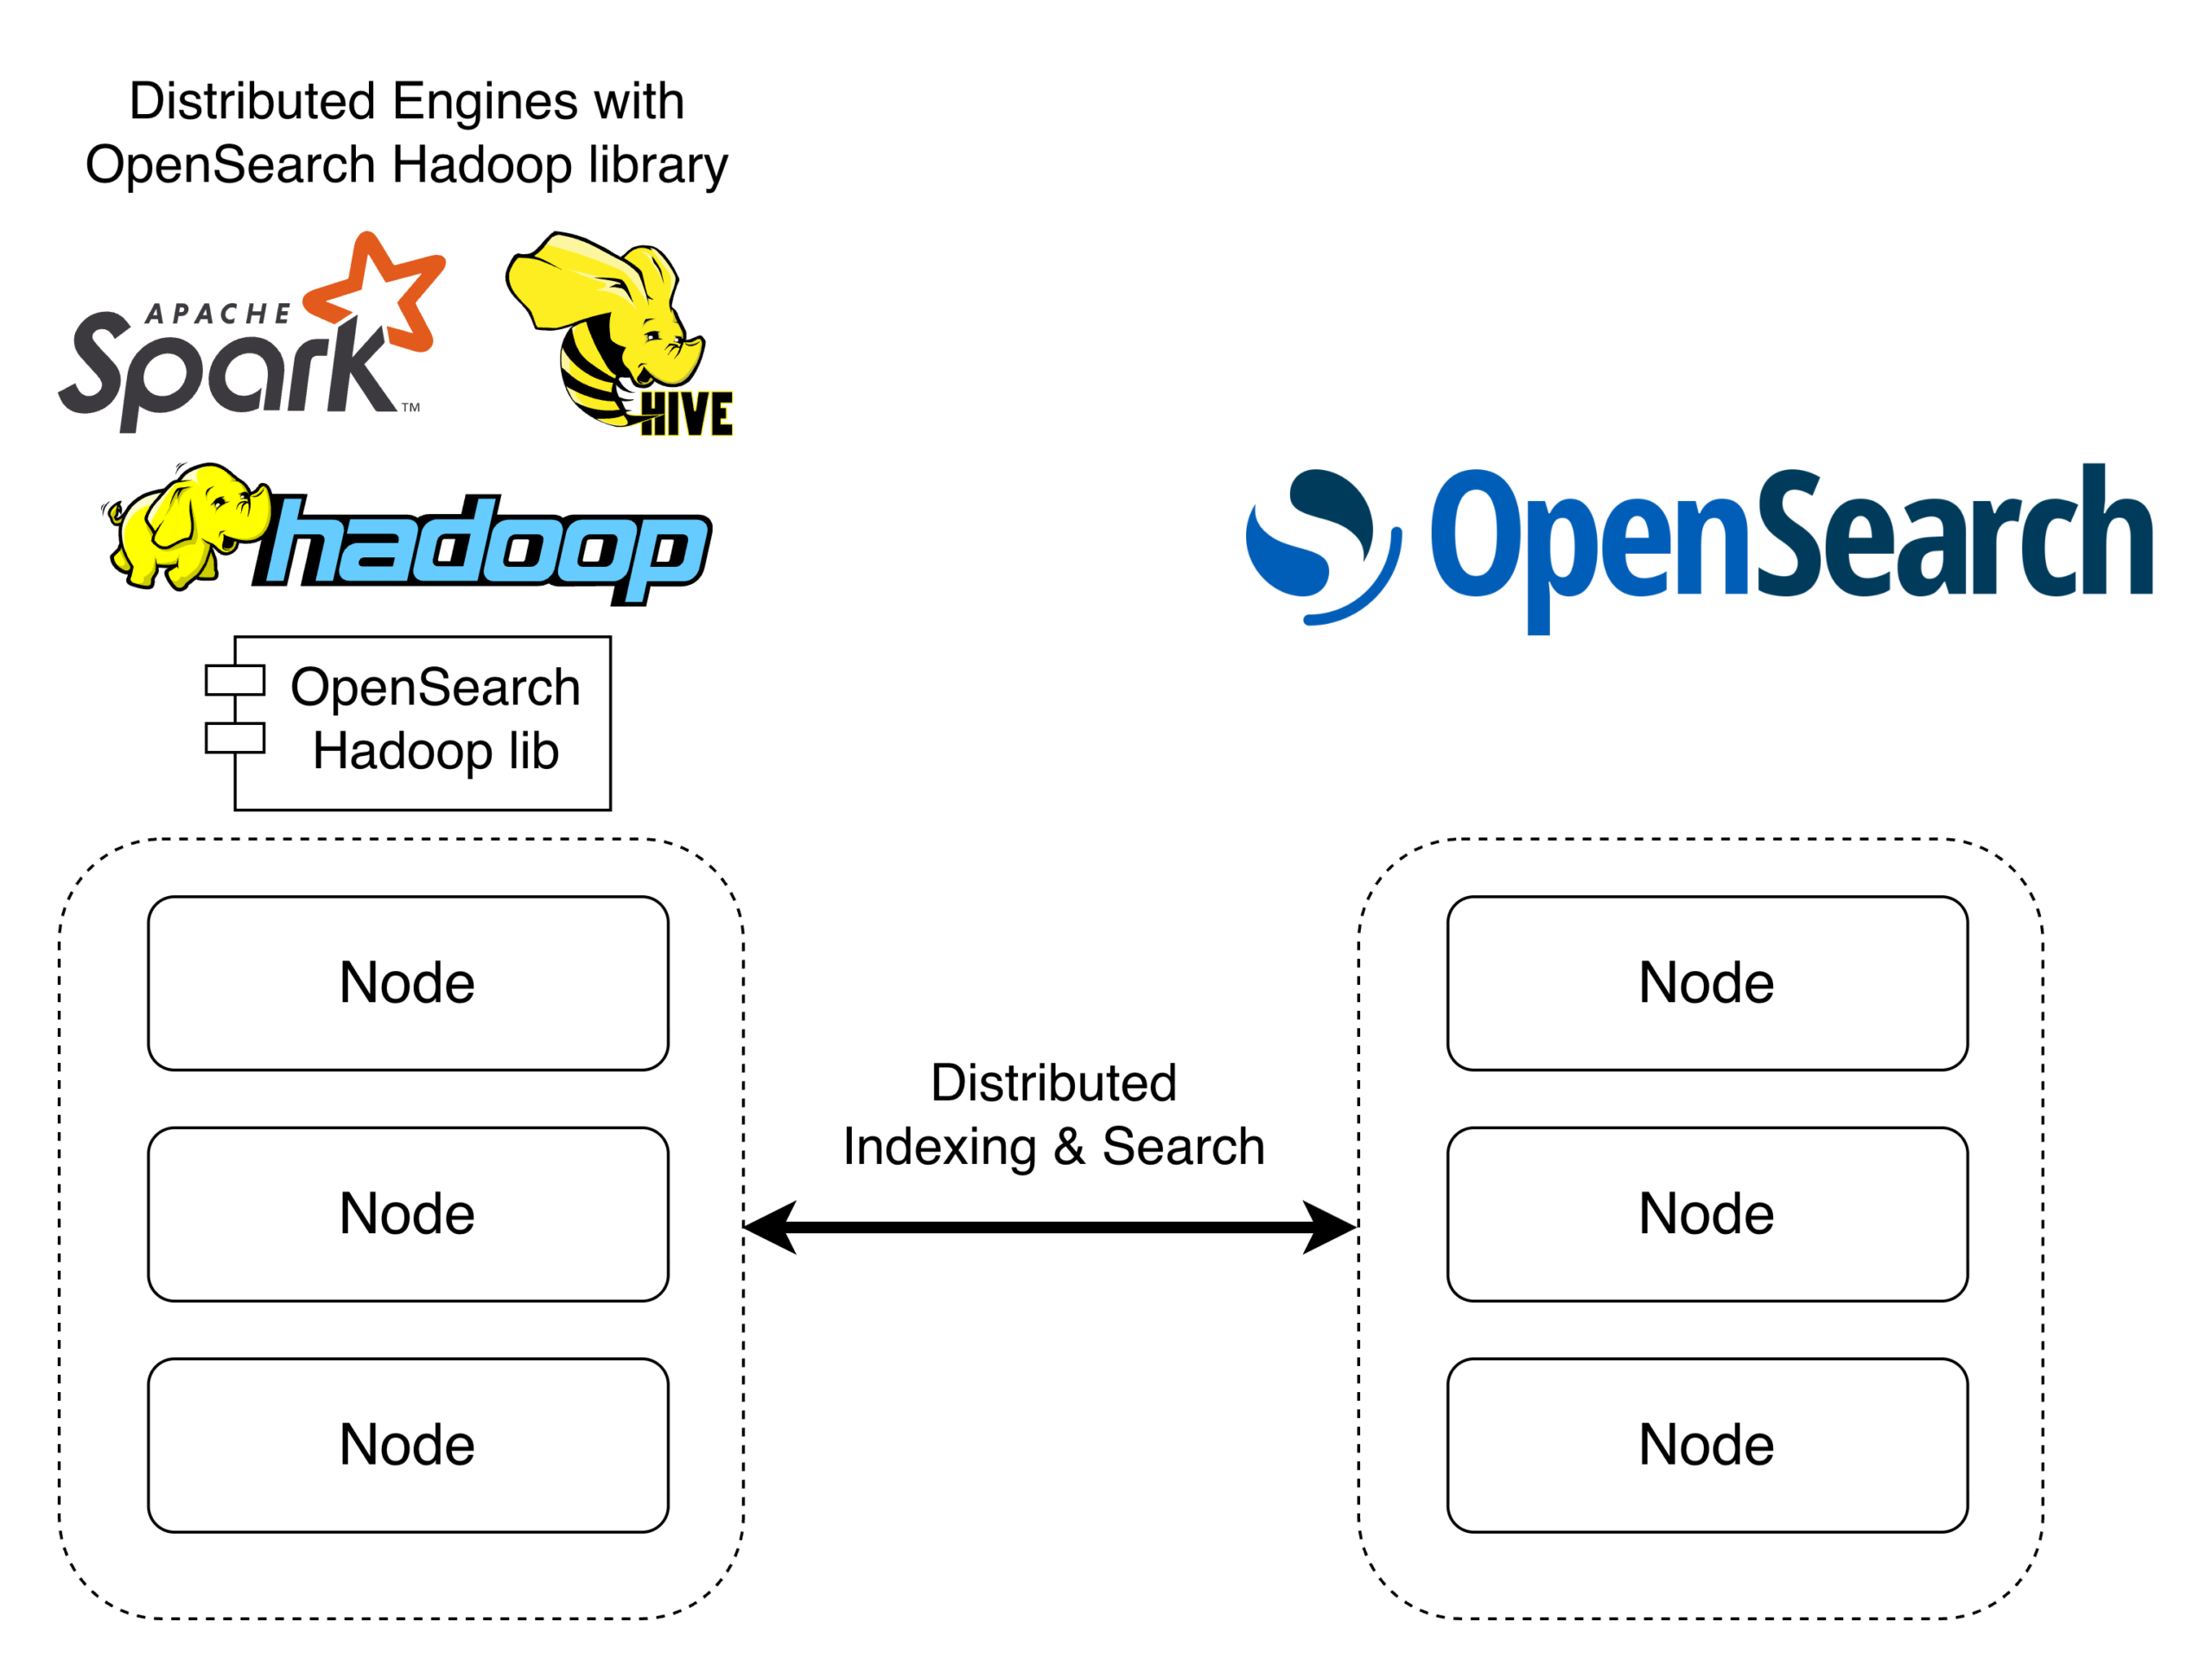
The OpenSearch Hadoop connector 2.0 has been released, introducing support for Apache Spark 3.5 and 4, as well as official compatibility for OpenSearch 3.x. The update also adds su…

The article argues that deploying a SIEM without first establishing a "visibility foundation" often results in expensive, unmanageable systems overwhelmed by uninvestigated alerts.…
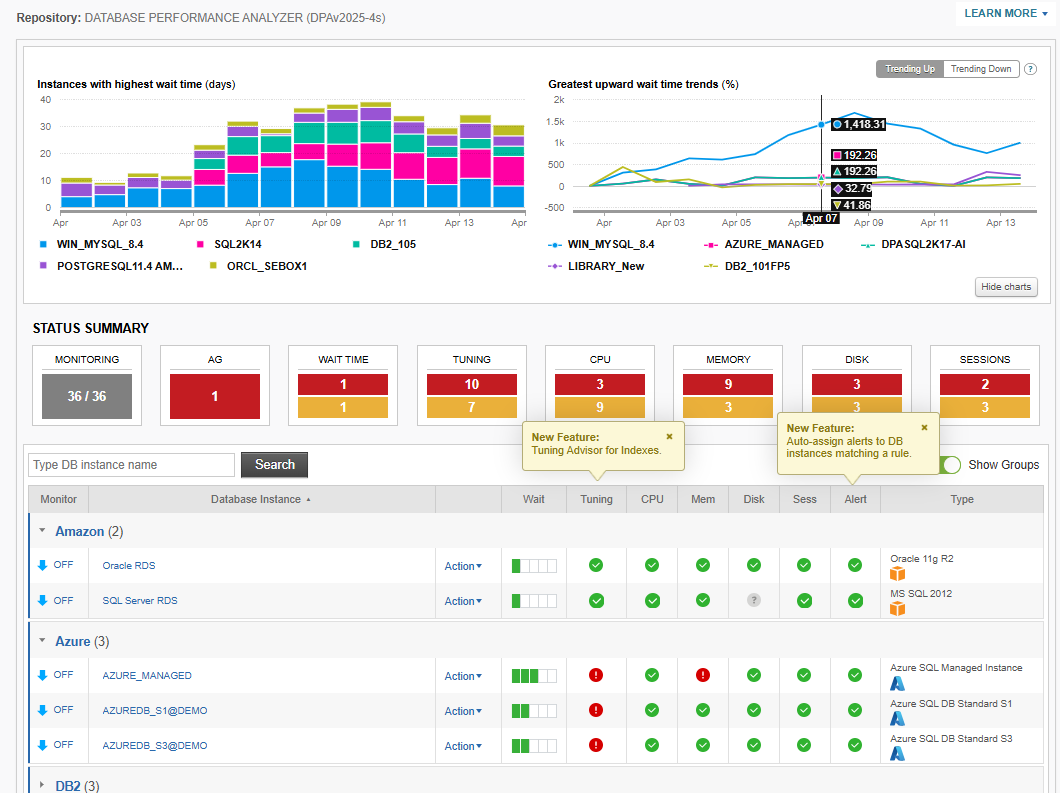
This guide helps users select the appropriate SolarWinds database monitoring solution based on their specific environment and monitoring goals. It compares three key products: DPA …
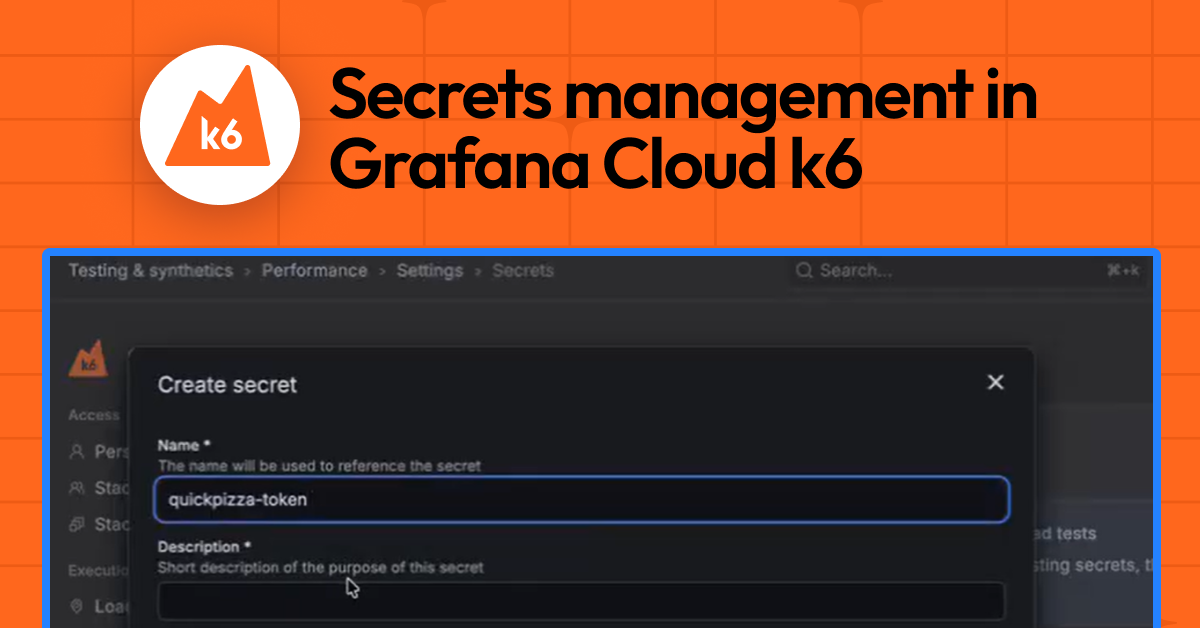
Grafana Cloud k6 has introduced a new secrets management feature to securely store and inject sensitive credentials, such as API tokens, into performance tests at runtime. This upd…
The OpenTelemetry Japanese Community Survey reveals a mature landscape in Japan, with nearly 87% of respondents already using or evaluating the technology and a notable preference …

New Relic has announced that its Cloud Cost Intelligence (CCI) will be generally available on April 28, 2026, offering an observability-native solution to unify cloud spend managem…

This article explains how effective Kubernetes application monitoring reduces incident resolution time by unifying metrics, logs, and traces with cluster-level data. It provides a …
.png?h=2394737d&itok=wckUrQAD)
Effective infrastructure monitoring focuses on a curated set of actionable metrics that connect system health to user experience and business outcomes, rather than tracking every p…